An effort to clarify the role of deliberative evaluation in the planning and policy-making process. Thorbjørn Mann, March 2020
CRITERIA AND CRITERION FUNCTIONS
Concepts and Rationale
One of the key aspects of evaluation and deliberation was discussed earlier (in the section on deliberation) as the task of explaining to one another the basis of our evaluation (quality / goodness) judgments, to one another: ‘objectification’. It means to show how a subjective ‘overall’ evaluative judgment about something is related to, or depends on other — ‘partial’ — judgments, and ultimately, how a judgment is related to some objective feature or ‘criterion’ of the thing evaluated: a measure of performance. Taking this idea seriously, the concept, its sources, and the process of ‘making judgments a function of other judgments’ and especially of criteria, should be examined in some more detail.
There is another reason for that examination: it turns out that criterion and criterion functions may offer a crucial connection between different ‘perspectives’ involved in evaluation in the planning discourse: the view of ‘formal evaluation’ procedures such as the Musso-Rittel procedure [1, 2] , the systems modeling domain, and the argumentative model of planning.
The typical systems model is concerned with exploring and connecting the ‘objective’ components of a system, the variables describing the interaction between them, for example in ‘simulation models’ of the systems behavior over time. The concern is with measures of performance: criteria. The systems model does not easily get involved with evaluation — since this would have to tackle the issues of the subjective nature of individuals’ evaluation judgment: the model output is presented to decision-makers for their assessment and decision; but also often falls victim to the temptation of declaring some ‘optimal’ value of an objective performance variable to be the proper basis for a decision.
The familiar ‘parliamentary’ approach to planning and policy decision-making accepts the presentation of a proposed plan and the exploration of its ‘pros and cons’ — arguments as the proper basis for decisions (but then reverts to voting as the decision-making tool, which potentially permits disregarding all concerns of the voting minority, a different problem). The typical arguments in such discussions or debates rarely get beyond invoking ‘qualitative’ advantages and disadvantages: — evaluation ‘aspects’ in the vocabulary of formal evaluation procedures –, and refers to quantitative effects or consequences (criteria‘) only in a rhetorical and not very systematic manner. The typical ‘planning argument’ assumption of the conditions under which its main instrumental premise will hold (ref. the section__ on argument evaluation) is usually not even made explicit — taken for granted — even though it would actually call for a thorough description of the entire system into which the proposed plan will intervene, complete with all its quantitative data and expected tracks into the future.
These considerations suggest that the concepts of criteria and criteria functions can be seen as the (often missing) link between the systems modeling view, the argumentative discourse, and the formal evaluation approach to planning decision-making.
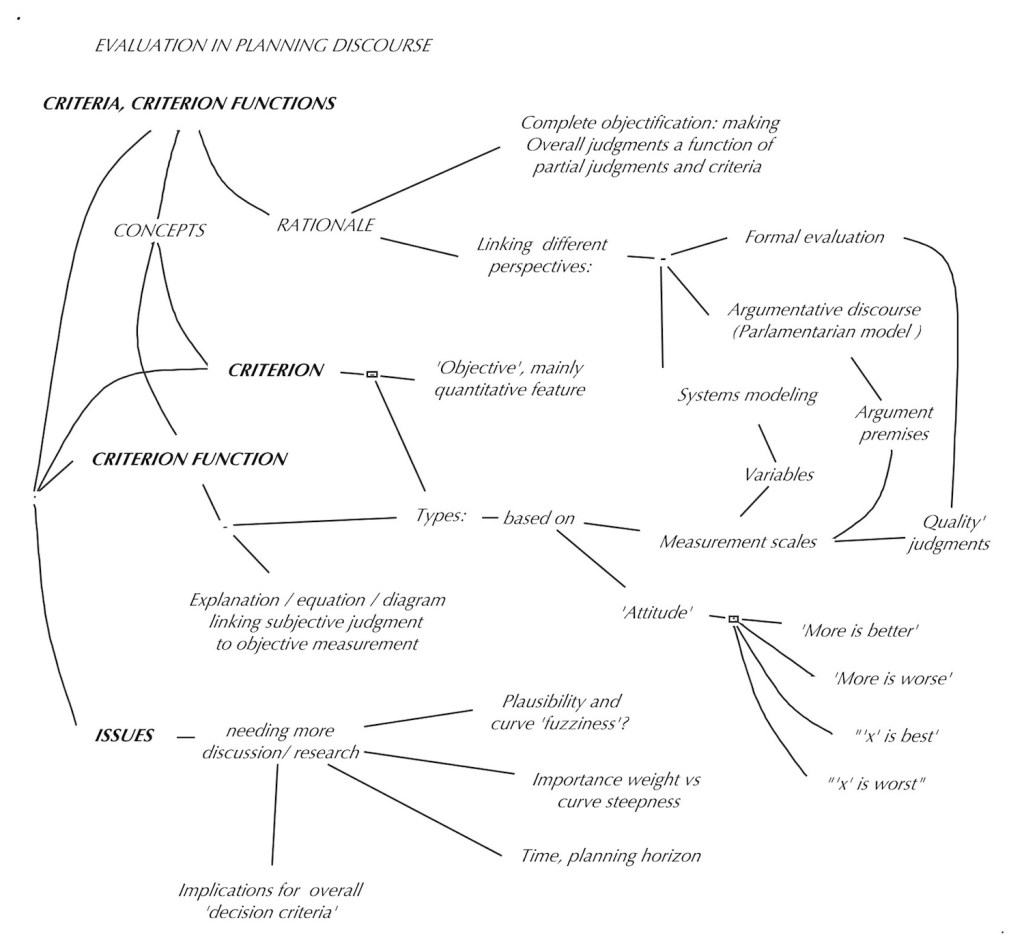
Criteria types
Another understanding of ‘criterion’ pertains to the assessment of that explanation: the level of confidence of a claim, the level of plausibility of arguments; and the degree of importance of an aspect. Since the assessment of plans involves expected future states of affairs that cannot be observed and measured as matters of fact in reality (not being ‘real’ yet, just estimated, predicted), those estimates even of ‘objective’ features must be considered ‘subjective‘ no matter how well supported by calculations, systems simulation, and consistency of past experience with similar cases. The degree of certainty or plausibility of such relationships may be considered by some as an ‘objective fact’ feature of the matter — but the decisions we make and refer to in our explanation of out judgments to each other are subjective estimates of that degree — and that will the result of the discussion, debate, deliberation of the matter at hand. These criteria may be called ‘judgment assessment criteria’.
‘Solution performance’ criteria
These criteria are well known, and have been grouped and classified in various ways according to evaluation aspect categories, in architecture starting with Vitruvius‘ triad of aspects ‘firmness, utility (commodity) and delight’ (beauty). Interestingly enough, the explanation of beauty held more attention in terms of exploring measurable criteria such as proportion ratios than the firmness and utility aspects. In the more recent ‘benefit/cost’ approach that concern somehow disappeared or has been swallowed up in one of the‘benefit/cost’ categories that measures both kinds with the criterion of money, which arguably is more difficult to connect with beauty in a convincing manner. Meanwhile, engineering has made considerably more progress in actually calculating structural stability, bearing loads of beams and trusses, resistance on buildings to wind loads, thermal performance of materials etc.
For all the hype about functional aspects, the development of adequate criteria has been less convincing: the size of spaces for various human activities, or walking distance between different rooms in places like hospitals or airports are admittedly easy to measure but all seem to be missing something important. That sense of something missing may have been a major impulse for the effort to get at ‘Quality’ in Christopher Alexander’s efforts to develop a ‘Pattern Language‘ for architecture and environmental design. [3]; ‘Universal design’ looks at functional use concerns of spaces by people with various disabilities but has paid more attention to suggesting or prescribing actual design solutions than to develop evaluation criteria. My explorations of a different approach try to assess the value of buildings by looking at the adequacy of places in the built environment for the human occasions they are accommodating, as well as the image the design of the place is conveying to occupants, and developing criteria such as ‘functional occasion adequacy’ and ‘occasion opportunity density’, ‘image adequacy‘ [4] Current concerns about ‘sustainability’ or ‘regenerative’ environmental design and planning seem to claim more, even dominant attention than earlier aspects; the development of viable evaluation criteria has not yet caught up with the sense of crisis. (An example is the attention devoted to the generation and emission of CO2 into the atmosphere: it seems to play a crucial role in global climate change — but the laudable proclamation of governments or industries of plans to‘achieve a level of x emission of CO2 within y years’ ) seem somewhat desperate (just doing something?) but not addressing the real effects either of the climate change itself, or the question of ‘what about the time after and up until date y’ — (paying ‘carbon offsets’ or taxes?).
Measurement scales for criteria
In exploring more adequate criteria, to guide planning decisions it is necessary to look at how criteria are measured: both to achieve better ‘objective’ basis for comparing alternative plans and to avoid neglecting important aspects just because they are and remain difficult to measure in acceptable objective ways, and will have to rely on subjective assessments by affected parties.
The ‘qualitative’ assessment of evaluation aspects will use judgments on the nominal and ordinal scale — both for the ‘goodness’ judgments and the ‘criteria’ . The fact that these are mostly subjective assessments does not relieve us from the need to explain to each other how they are distinguished, what we mean by certain judgments, and how they are related: that is, how ’criteria’ judgments explain ‘goodness’ judgments: the question of criterion functions that usually focus on explaining how our subjective ‘goodness’ judgments relate to (depend on) ‘objectively measurable performance criteria’ .
Criterion functions
Types of criterion functions
The concept of ‘criterion function’ was defined as the demonstration of the relationship between subjective quality judgments and (usually) objective features or performance measures of the thing evaluated, in the form of verbal explanation, equations, or diagrams.
A first kind of distinction between different kinds of such explanations can be drawn according to the scales of measurements used for both the quality judgments and the criteria. The following table shows some basic types based on the measurement scales used:

Table 1 — Criterion function types based on judgment scales
For simplicity, the types for the difference and ratio scale are listed together as ‘quantitative’ kinds. Further distinctions may arise from consideration whether the scales in question are ‘bounded’ by some distinct value on one or both ends, or ‘unbounded‘ — towards +∞ or -∞.
Another set of types are related to the attitudes of where the ‘best‘ and ‘worst‘ features are located: The attitudes will call for different shapes of diagrams:
“The more, the better”; “The less, the better”; “The value x on the criterion scale is best’, smaller or larger values are worse”; “The value x on the criterion scale is worst; lower or higher values are better”.
Further distinctions may arise from consideration whether the scales in question are ‘bounded’ by some distinct value on one or both ends, or ‘unbounded‘ — towards +∞ or -∞. The attitude ‘the more, the better’ will have the ‘couldn’t be better’ score at infinity; while it will be at zero (or even -∞ ?) for the opposite ‘the less, the better’ ; or the best or worst scores may be located at some specific value x of the performance criterion scale.
Criterion function examples

Table 8.2 Criterion functions type 1 and 2

Table 8.3 Criterion functions type 3,4,5,6
A common type 6 example with a bounded judgment scale and the performance scale bounded on zero at the low end and unbounded at +∞ at the other end is the following: Asked to explain the basis of our subjective ‘goodness / badness’ (or similar) judgment about a proposed plan, we can respond by drawing a diagram showing the objective performance measurement scale with its units as a horizontal line, and the judgment scale on on the vertical axis. For example, judging the ‘affordability’ of proposed projects, on a chosen judgment scale of -3 to +3, with +3 meaning ‘couldn’t be more affordable’ , the -3 meaning ‘couldn’t be more unaffordable’, and the midpoint of ‘zero’ meaning ‘can’t decide, don’t know, cannot make a judgment’.

Figure 2 A type 6 criterion function of ‘affordability’ judgments related to the cost of a plan
In the following, the discussion will be focused mainly on functions of type 6 — judgments expressed on a +U to -U scale (e.g. +3 to -3) with a midpoint of zero for ‘don’t know, can’t decide; neither good nor bad’, and some quantitative scale for the performance criterion.
The criterion function lines can take different shapes, depending on the aspect. For some like the cost aspect in the first example above, the rule ‘the more, the worse’ will call for a line declining towards the +∞ right; many aspects call for a ‘the more, the better’ rising from zero to (or -∞?) towards +∞ on the opposite end for others there may be a ‘best’ or ‘worst’ point in-between value. Some people may wish to have a building front in what is widely consider the ‘most beautiful’ proportion, the famous ratio 1:1.618…

Figure 8.3 — Four different ‘attitude’ curves of type 6 criterion functions
Expectations for Criterion functions; Questions
There are some aspects of rationality attached to the criterion function concept. The line expresses the judgment of a cost-conscious client, and of course getting the project ‘for free’ would deserve the score of +3 ‘couldn’t be better / more affordable’. The line would approximate the bottom judgment of -3 towards infinity: for any cost however large, it could be even worse. So +3 and -3 judgment scores should be assigned only if the performance r e a l l y couldn’t be better or worse, respectively. Furthermore, we would expect the line to be smooth, in this case smoothly descending: it should not have sudden spikes or valleys. If the cost of a Plan A could be reduced somewhat, the resulting score for the revised solution A’ should not be lower than the score for the original version of A. But should that prohibit superstitious evaluators from showing such dips in their criterion function lines, e.g. for superstitiously ‘evil’ numbers like 13? There are many building designs that avoid heights resulting in floor levels with that number — or, if the building are higher, just don’t show those floors on the elevator buttons?. Al
Where should a person’s judgment line ‘reasonably’ cross the 0 axis? It might be the amount of money the client has set aside for the project budget: as long as it’s on the ‘+’ side, it’s ‘affordable’ and the lower the cost, the better; the more, the worse and less affordable. This shows that the judgment line, the ‘criterion function‘, will be different for different people: it is subjective, because it depends on the client’s budget (or credit limit), but ‘objectified’ (explained) by showing how the affordability judgment score relates to the actual expected cost. For a wealthier client, the line would shift toward the right; a less affluent client would draw it more steeply to the left. (Of course even this simple and plausible criterion might raise discussion: does ‘cost’ mean ‘initial construction cost’ or ‘client equity’, or some time-related cost such as ‘average annual cost including mortgage payments etc.’ or ‘present value of all the costs, initial plus annual costs (each ‘discounted back to present worth) for a specified planning horizon”?)
There can be more complex criterion functions, with two or more variables defining judgment categories. Figure 8.4 shows a function diagram for clothing sizes (pants) — a variation of the simple version in the above example. The sizes are roughly defined by ranges of pants legs and waistlines (roughly, because different manufacturers styles and cuts will result in some overlap in both dimensions). The judgment scale is the‘comfort’ or ‘fit’ experienced by a customer expressed e.g. on the +3 to -3 scale. The ‘best’ combination would of course be the ‘bespoke’ solution that can only be achieved by the tailor creating the garment for the specific measurements of each individual customer. The ‘fitness’ judgments — in the third dimension — will be a smooth mountain with its +3 top located above the specific measurement, with widening altitude lines (isohypses) for less perfect fits. The ‘so-so’, or ‘just acceptable’ range would cover an area within one of the ‘size’ regions, or actually overlapping borders. The area would likely be a kind of ellipse with a narrower range for leg length and allowing for a greater variation of waistline (accommodated by a series of holes in the belt, for before-and after dinner adjustment…). This example also demonstrates nicely that the evaluation judgment ‘fit’ is a personal, ‘subjective’ one even when it involves an ‘objectively’ measurable variable.
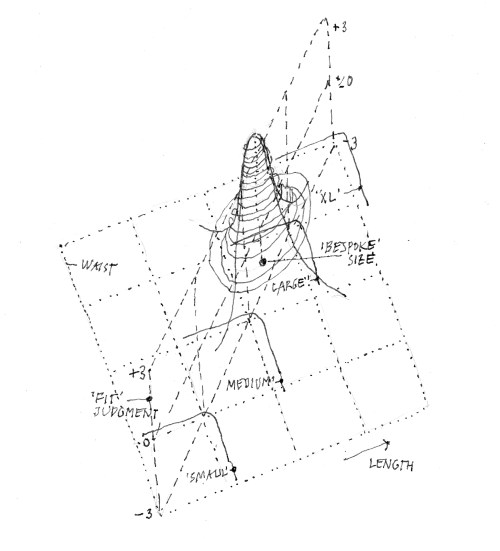
Figure 8.4 — A ‘3D’ criterion function for a ‘feature’ domain defined by two variables.
In his Berkeley lectures, Rittel proposed mathematical equations for the four basic function shapes, to calculate the judgment scores for different performance values. This may be useful for evaluation tools that have been agreed upon as‘standards’, such as government regulations. However, for lay participants to express their individual assessments, to specify the different parameters to generate the specific curves would be unrealistic. Should they not be a fuzzy broad band expressing the approximate nature of these judgments, instead of a crisp fine line?

Figure 8.5 ‘Should the criterion function be drawn as ‘fuzzy’ lines?
So it will be more practical to simply ask participants to draw their personal line by hand, with a fat pencil or brush, after indicating the main preferences about the location of ‘best‘ and ‘worst’ performance, and where the lines should cross the center ‘zero’ judgment axis.
Equations expressing evaluation judgments would undoubtedly be desirable if not necessary for AI tools that might aim to use calculations with successive approximation to find ‘optimal’ solutions. But whose evaluations should those be? The discussion of evaluation so far has shown that while the judgment part of objectification are subjective; getting ‘universal’ or societally accepted ‘norms would require agreed-upon (or imposed, by evaluation or systems consultants) aggregated ‘curves’.(see the sections on aggregation and decision criteria). Some authors [5, 6 ]simplify or circumvent this issue by proposing simple straight lines — for which equations will be easy to establish — such as in one of the examples below, suggesting that these should be used as common policy tools like government regulations. This needs more discussion. The example shows a criterion function for the predicted total cost for a specific project, with the function crossing the ‘zero’ line at some ‘neutral’ or ‘acceptable’ value of cost for a building of the given size. The question arises why a solution achieving a lower cost than that of 105,000 (where the line breaks from +5 into the sloped line) should not get a better judgment; but it would be more cumbersome to establish the equation for a curve that gradually approximates the zero cost on the left and the infinitely high cost on the right and also crosses the zero judgment line at the selected neutral value of 210.000. The equation shown in the second line Y.1 of the example is easy to generate and use, but arguably somewhat arbitrary.

Figure 8.5 Simplifying the judgment curves with straight lines [5]
Criteria for discourse contributions; judgments, argument assessment.
Could the criterion functions be modified according to the plausibility (confidence) assessment for the evaluation of argument plausibility (whose deontic ought-premise is identical or
conceptually linked to the ‘goodness’ aspect of formal evaluation of the Musso-Rittel type? The corresponding criterion function lines would be the more ‘flattened’ towards the ‘zero’ line honestly representing ‘don’t know’ the closer the plausibility judgment for the deontic premise approaches that zero value (on the assumed -1 to +1 plausibility scale). This would still express the person’s preferences on the criterion, but adjust the impact of that aspect according to the level of confidence of the solution pursuing and achieving that goal.
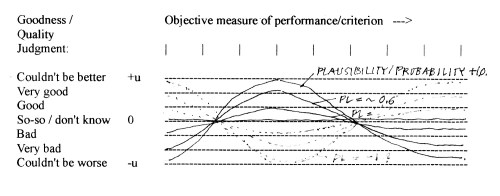
Figure 8.6 — Plausibility – modified quality criterion functions.
There are also questions about the way these functions might be manipulated to generate ‘bias’. For example: A participant who has assigned the aspect in question a low weight of relative importance might be tempted to draw the criterion function line steeper or less steep to increase that aspect’s impact on the overall assessment.
The extent to which participants will be led to consider evaluation aspects or arguments contributed by other participants and make them part of their own evaluation will depend on the
degree of confidence, plausibility, credibility with which these entries are offered: how well is a claim ‘supported’ by evidence or further arguments? This aspect is sometimes discussed in general terms of ‘breadth‘ and ‘depth’ of support, or in more ‘scientific‘ terms by the amount of ‘data’, the rigor of collecting the data and analyzing its logic of inference and statistical ‘significance’. It should be obvious that simple measures such as ‘counts’ of claims oaf breadth (the number of different claims made in support of a judgment) and depth (the number of claims supporting claims and their support, aspects, sub-aspects, arguments and support of premises and evidence for each premise etc.) are meaningless if those claims lack credibility and plausibility, or are entirely ‘made up’.
Support of claims or judgments can be ‘subjective’ or ‘objective’. But the general attitude is that ‘objective’ claims well supported by ‘facts’ and ‘scientific validity‘ carry a greater strength of obligation for others to accept in their ‘due consideration‘ than ‘subjective’ claims without further supporting evidence or argument that each person may have the right to believe but cannot expect everybody else to accept as theirs. A possible rule may be to introduce the concern for others as a standard general aspect in the overall evaluation aspect list, but keep the impacts of a criterion on one’s own part and the impact on others on separate aspects and criterion functions. The weight or impact (i.e. how much are our judgments influenced by somebody’s argument or claim) we then accord that aspect in our own judgment will very much depend on the resulting degree of plausibility. All this will be a recurring issue for discussion.
The ‘criterion function’ for this second kind of criterion: plausibility, will take a slightly different form (and mathematical expression, if any) than those pertaining to the object goodness assessment. For example, the plausibility of a pro or con argument can be expressed as the product (multiplication) of the plausibility judgments pl of all its (usually two or three) premises:
Argpl(i) = pl(FI-premise) * pl(D-premise) *pl(F-premise) * pl(Inference rule)
of the standard planning argument :
D(PLAN A) (Plan A ought to be adopted) because
FI(A–> Outcome B given conditions C) (Given C, A will produce B) , and
D(B) (B ought to be achieved), and
F(C) (Conditions C are / will be present).
The ‘criterion function’ for this assessment for only the two main premises FI (A –> B) and D(B) , takes the form of a 3D surface in the ‘plausibility cube:

Figure 8.7 — Argument plausibility as a function of premise plausibility (two premises)
Here, D(x) denotes the Plan proposal, D(y) is the deontic claim of desired outcome, and F(xRELy) is the factual-instrumental claim that Plan x will produce outcome y. [7]
Evaluation and time: changing future performance levels
All assessments of ‘goodness’ (quality) or plausibility of plans are expectations for the future. So judgments about a plan’s effectiveness are — explicitly or implicitly — based on some assumption about the time in the future at which the expected performance will be realized. For some kinds of projects, it will be meaningful to talk about plan effects immediately on implementation: ‘fixing’ a problem for good when executed. The Musso/Rittel and similar criterion functions are based on that assumption. However, many if not most public plans will reach full effectiveness only after some initial ‘shake-down’ period (during which the problem may actually be expected to first get worse before getting better) and to different degrees over time. For most plans, a ‘planning horizon’ or life span is assumed; expected benefits will vary over time, and eventually decline and stop entirely. The only specific assessment criteria for this are the computations of economic aspects: initial versus recurring costs and benefits, and their conversions into‘present value’ or ‘annual’ or ‘future value’ equivalents , based on personally different discount rates for the conversion, and estimates of ‘planning horizons’.
As soon as this is taken into consideration, it becomes obvious that difference of opinion may be based on different assumptions about this, and the need arises for making these assumptions more explicit. This means that the expected ‘performance track’ of different plan solutions over time should be established and made visible in the evolving criterion functions. This aspect (to my knowledge) has not been adequately explored and integrated into evaluation practice.

Figure 8.8. Evaluation of alternative plans over time
The diagram is a first attempt at displaying this. It could be seen as the task of comparing two different plans for dealing with the issue of human CO2 emissions, with the expected ‘do nothing‘ alternative. One plan (A) will show continuing emission levels for some period before reversing the direction of the trend); the other (B) is assumed to take effect immediately but not as strongly as plan A. This suggests that the better basis of comparison would be the ‘areas’ of ‘improvement’ or ‘worsening’ in the judgment surface over time — in the diagram shaded for plan A.
Anther question arising in this connection — besides the suggestion above that the expected trends should be drawn as ‘fuzzy’, broad tracks, rather than the crisp lines printed out by the computer simulations — is the aspect that any plausibility (probability) estimates for the predictions involved are also likely to decline, from initial optimistic certainty down and more honestly towards the zero middle line — “not sure”, “don’t know”.
Preliminary conclusions
For discussion, including criterion functions in the deliberation process offers some interesting improvement possibilities compared to conventional practice:
- A more detailed, specific description of the basis of judgment of participants in the discourse;
- The ability to develop overall group or ‘community’ measures of collective merit of proposed plans, with specific indication of the plan details about which participants disagree, and thus opportunities for finding plan modifications leading to improvements of assessment and acceptance. For example, while it is possible to construct functions based on preference rankings of solutions, (which do not show the spread of the ranking scores, nor the overall location of ranking clusters on a performance measure scale), the comparison of criterion function curves can facilitate the identification of ‘overlap’ regions of acceptable solutions.
- It should be obvious that overall ‘group’ assessment indicators must be based on some aggregation of individual (or partial group) judgment scores; these can then be used for varieties of Pareto-type analysis and decision criteria. Instead of just using e.g. ‘averaged’ group scores — or scores ‘weighted’ by the number of members of the different subgroups or parties — decision criteria based on such aspects as degrees of improvement offered to different subgroups by the different plan versions can be developed. (See the section on decision criteria, which should be clearly distinguished from the evaluation criteria discussed here, used for individual assessment)
The questions arising from this tentative discussion suggest that this part of the evaluation component of planning discourse, and especially public planning discourse, with wide public participation by affected parties spread over different administrative constituencies, need more research and discussion.
–o–
References
[1] Musso, Arne and Horst Rittel: “Über das Messen der Güte von Gebäuden” in “Arbeisberichte zur Planungsmethodik 1” Stuttgart 1969. In English: “Measuring the Performance of Buildings”, Report about a Pilot Study, Washington University, St. Louis, MO 1967.
[2 ] Dehlinger, Hans: “Deontische Fragen, Urteilsbildung, Bewertungssysteme” in “Die Methodische Bewertung: Ein Instrument des Architekten”: Festschrift zu Prof. Musso’s 65. Geburtstag. Technische Universität Berlin 1993.
[3] Alexander, C. et al. “A Pattern Language” Oxford University Press, New York 1977.
[4] Mann, T. “Built Environment Value as a Function of Occasion and Image” Academia.edu Also::
‘Rigatopia”, LAP, Lambert Academic Publishing, Saarbrücken 2015
[5] Musso, Arne “Planungsmodelle in der Architektur” Technische Universität Berlin, Fachgebiet Planungsmethoden: (Berlin 1981)
[6] Höfler, Horst: “Problem-darstellung und Problem-lösung in der Bauplanung”, IGMA-Dissertationen 3,
Universität Stuttgart 1972.
[7] Mann, Thorbjoern: “The Fog Island Argument” Xlibris, 2009. Also: “The Structure and Evaluation of Planning Arguments” in INFORMAL LOGIC, Dec. 2010.

0 Responses to “EVALUATION IN THE PLANNING DISCOURSE: CRITERIA AND CRITERION FUNCTIONS”